Fig. 1.
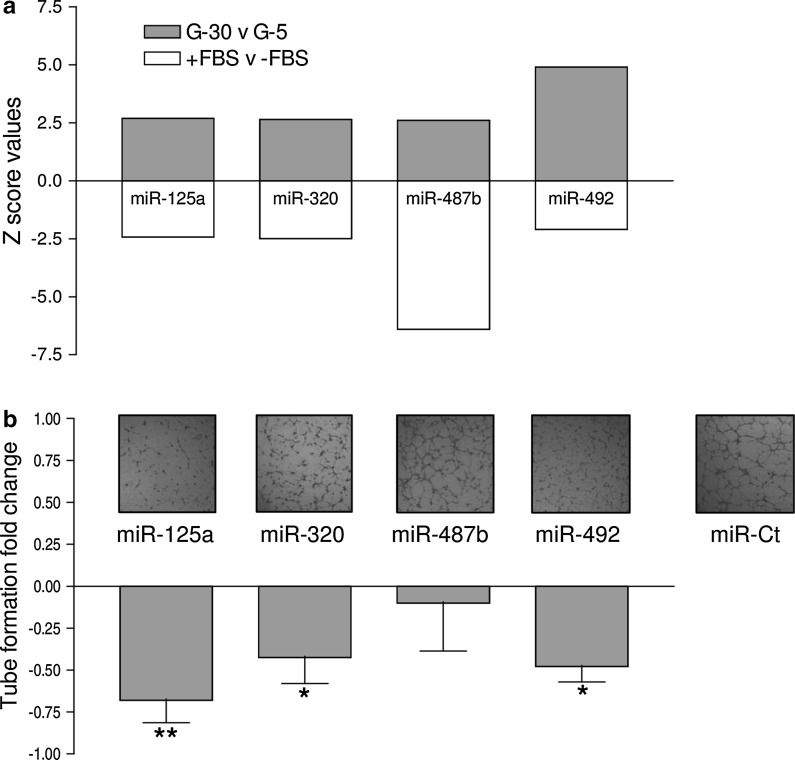
Positive and negative Z score values of miR-125a, miR-320, miR-487b and miR-492 resulting from the miRNA microarray comparative analysis of 30 mM (G-30) versus 5 mM (G-5) glucose treated HUVECs and FBS plus (+FBS) versus FBS minus (−FBS) treated HUVECs (a). Tube formation of HUVECs transfected with miR-125a, miR-320, and miR-487b and miR-492 (green bar chart): tube formation was reduced by miR-125, miR-320 and miR-492; representative pictures of tube formation are shown above the relative bar (b). (Color figure online)

