Fig. 4.

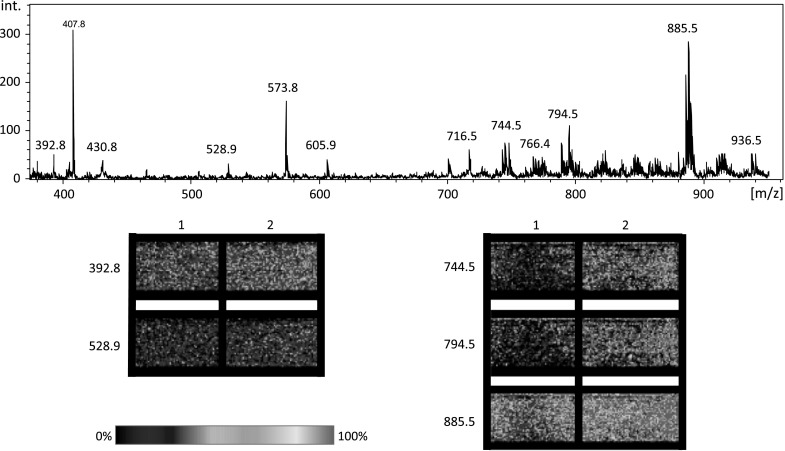
Average spectrum from the cell culture treated with 200 μM of hydrogen peroxide. Below the spectrum are images from Biomap indicating the abundances of the selected peaks in every sample (1 control, 2 200 μM H2O2)

Average spectrum from the cell culture treated with 200 μM of hydrogen peroxide. Below the spectrum are images from Biomap indicating the abundances of the selected peaks in every sample (1 control, 2 200 μM H2O2)