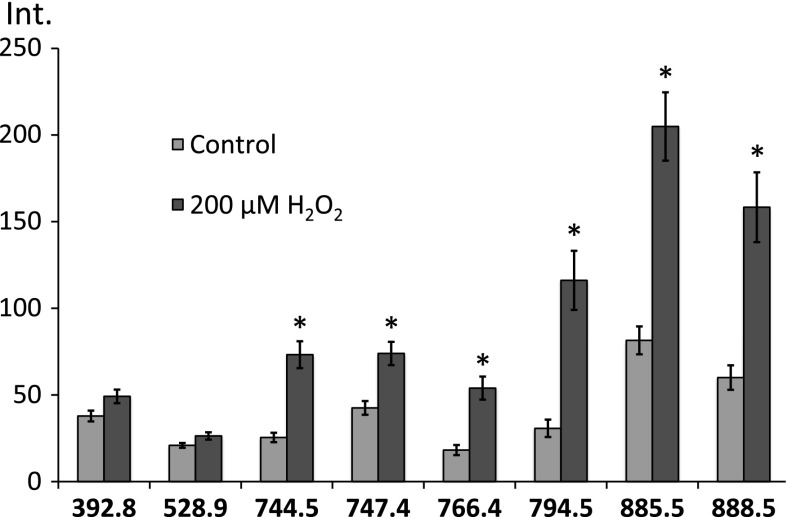
Fig. 5.
Fluctuation of selected ion intensities after treatment with hydrogen peroxide. Peaks at 392.8 and 528.9 were background, and indicated insignificant variability among samples, in contrast to those representing lipids, shown on the graph. Differences between corresponding values, for the same peaks, marked with an asterisk are significant (p value <0.05)

