
Fig. 2.
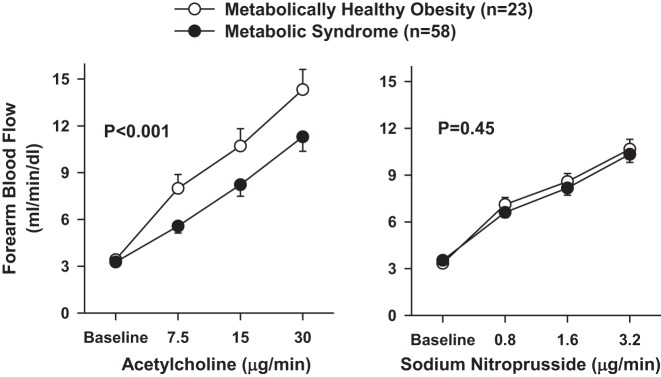
Plots showing forearm blood flow responses to intra-arterial infusion of escalating doses of acetylcholine (left) and sodium nitroprusside (right) in patients with metabolically healthy obesity and the metabolic syndrome. P values refer to the comparisons of vascular responses by 2-way analysis of variance for repeated measurements. All values are means ± SE.