Fig. 4.
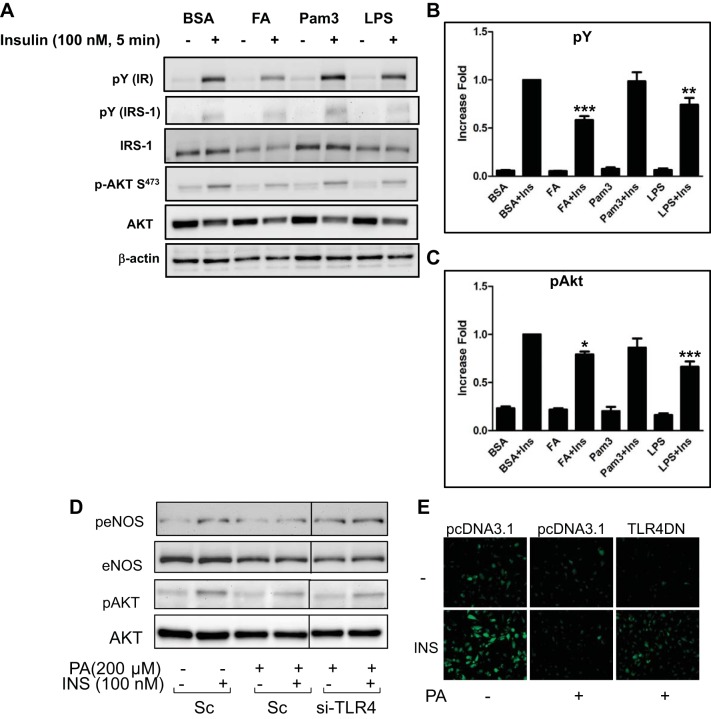
Activation of TLR4 impairs insulin signaling. A–C: HEK-293 cells were stably transfected with TLR4 and MD2 as described in material and methods. Cells were serum starved with medium containing 0.1% horse serum for 2 h and then treated with palmitate (PA, 100 μM), Pam3Csk4 (Pam3, 1 μg/ml), or LPS (1 μg/ml) for 24 h, followed by treatment with insulin (100 nM, 5 min). Cell lysates were collected and subjected to Western blot analysis. Blots were incubated with indicated antibodies. Representative blots are from 3 independent experiments. Tyrosine phosphorylation of insulin receptor (IR) and IRS-1 was detected by blotting a whole lysate with anti-phosphotyrosine antibody. A: phosphorylation of Akt was detected using anti-pAkt. B: tyrosine phosphorylation was normalized to β-actin. C: p-Akt is normalized to total Akt. Quantification of 3 independent experiments is shown in bar graphs (means ± SE). ***P < 0.001, **P < 0.01, *P < 0.05: samples are statistically different vs. insulin-treated samples. D: bovine aortic endothelial cells (BAECs) were trasfected with scrambled or siRNA for TLR4. Two days later, cells were treated with BSA or palmitate (200 μM, 4 h). Cell lysates were collected and subjected to immunoblotting. Representative blots are from 3 independent experiments. Demarcated lines are due to the noncontiguous lanes but are from a single gel. E: BAECs were transiently transfected with vector (pcDNA 3.1) or dominant negative construct of TLR4 as described in material and methods. After cells were incubated for 48 h, they were serum starved for 2 h and then were loaded with the NO-specific fluorescent dye DAF2-DA. Cells were pretreated with BSA or palmitate (200 μML, 4 h) and then treated without or with insulin (100 nM) for 20 min. After insulin treatment, cells were fixed with 2% paraformaldehyde and visualized with an epifluorescent microscope as described in material and methods. Emission of green fluorescence is indicative of NO production. Experiments shown are representative of those independently repeated ≥3 times.

