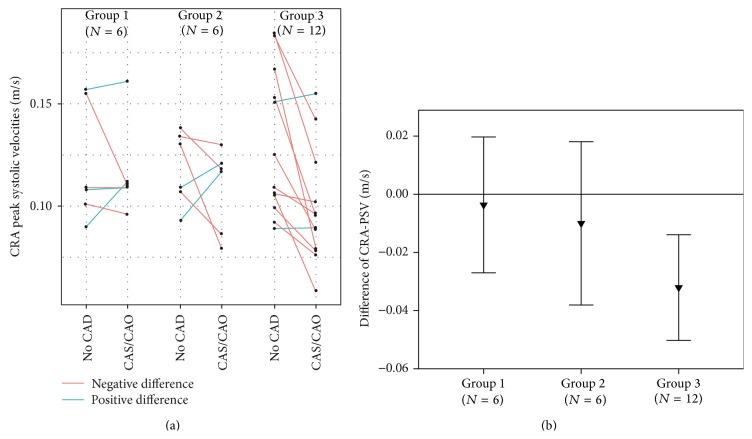
Figure 2.
Results of peak systolic velocity (PSV) in the central retinal artery (CRA). (a) shows the individual measurements in stenosis subgroups. (b) shows PSV differences (PSV intereye difference = PSV CAS/CAO side − PSV no-CAD side) of stenosis subgroups. CAD: carotid artery disease; CAS: carotid artery stenosis; CAO: carotid artery occlusion, Group 1: CAS 50–79%; Group 2: CAS ≥ 80%/CAO with nonretrograde OA; Group 3: CAS ≥ 80%/CAO with retrograde OA.

