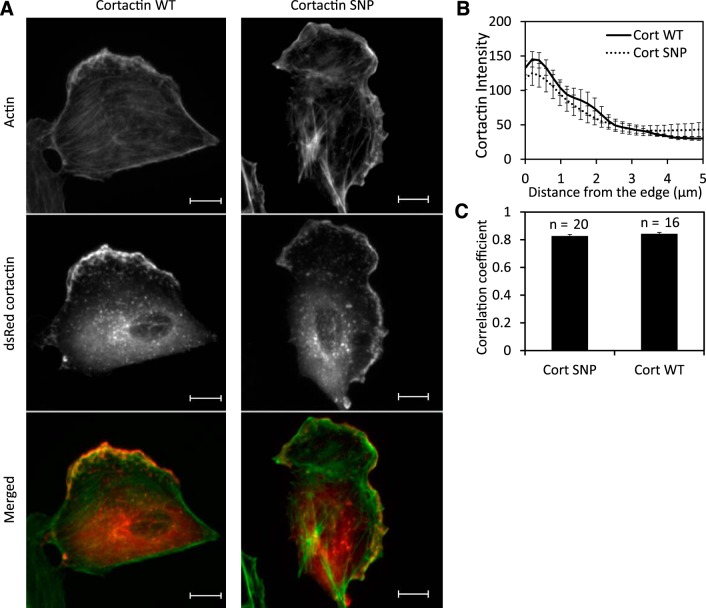
Fig. 10.
Colocalization of cortactin with actin in BAECs. A: localization of actin (green) and DsRed cortactin (red). Scale bars, 10 μm. B: fluorescence intensity measurements along the line scan perpendicular to the moving direction of lamellipodia. n = 9 BAECs overexpressing WT cortactin or cortactin SNP. C: correlation coefficient between fluorescence intensities of actin and DsRed cortactin. The subregion of a cell for the correlation analysis was defined to include the cell membrane boundary region.

