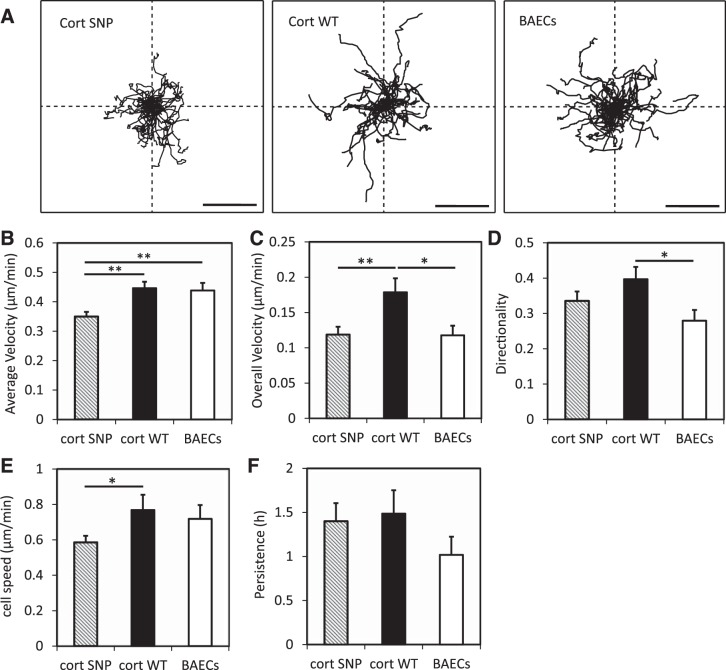
Fig. 5.
Quantified mobility of BAECs on collagen I-coated glass. A: wind rose plots for cell migration trajectories. Scale bars, 100 μm. B–D: average velocity (B), overall velocity (C), and directionality (D) were obtained as described in materials and methods. E and F: cell speed (E) and persistence (F) were obtained by fitting experimental cell migration data to a persistent random walk model. Error bars indicate SE. *P < 0.05, **P < 0.01. n = 41 nontransfected BAECs, n = 35 BAECs overexpressing WT cortactin, n = 41 BAECs overexpressing cortactin SNP.

