
Figure 3.
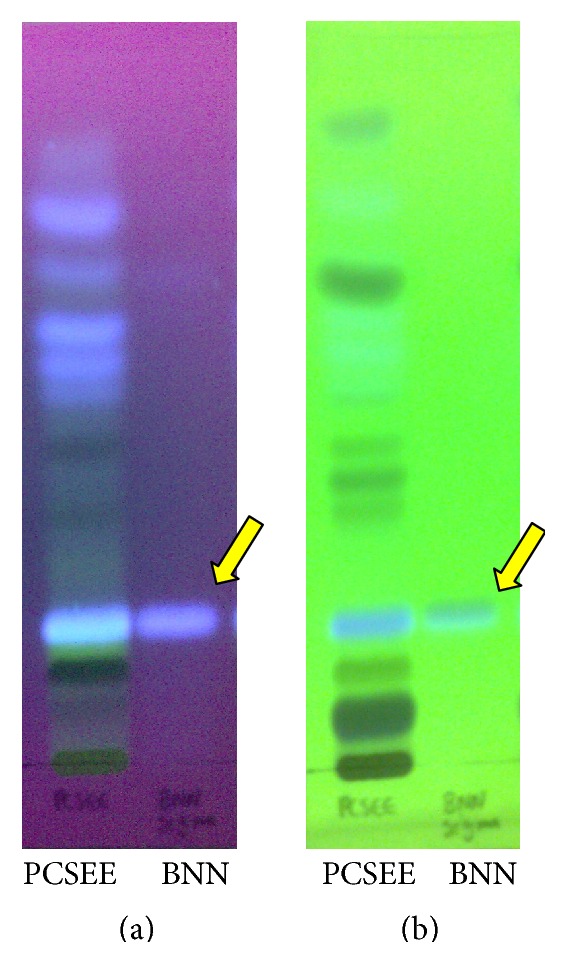
TLC plate's profile of PCSEE (left band) and BNN (right band) visualized (a) under UV 254 nm and (b) under UV 366 nm.
Official websites use .gov
A
.gov website belongs to an official
government organization in the United States.
Secure .gov websites use HTTPS
A lock (
) or https:// means you've safely
connected to the .gov website. Share sensitive
information only on official, secure websites.
TLC plate's profile of PCSEE (left band) and BNN (right band) visualized (a) under UV 254 nm and (b) under UV 366 nm.