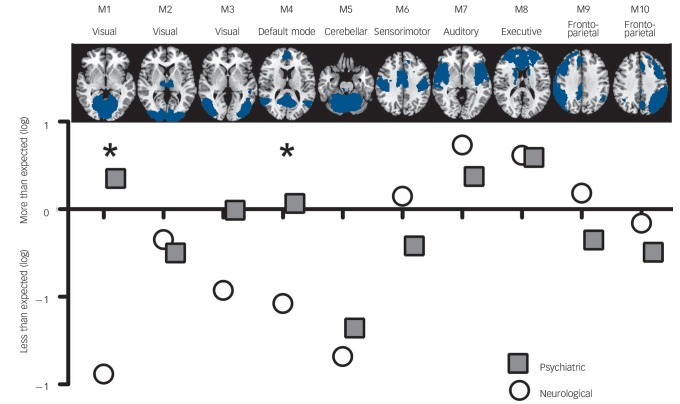
Fig. 3.
Network fingerprint for neurological (white) and psychiatric (grey) disorders.
This figure illustrates the distribution of neuroimaging abnormalities across networks for psychiatric and neurological disorders respectively. In particular, it shows whether psychiatric or neurological disorders affect each of our ten networks of interest more or less than expected (based on the total number of affected voxels). Values correspond to the logarithm of the ratio between observed and expected, with values below zero denoting that abnormalities are less frequent than expected and values above zero denoting that abnormalities are more frequent than expected. The asterisk indicates a statistically significant difference between the two classes at P<0.05 (one-tailed permutation tests).

