
Figure 4.
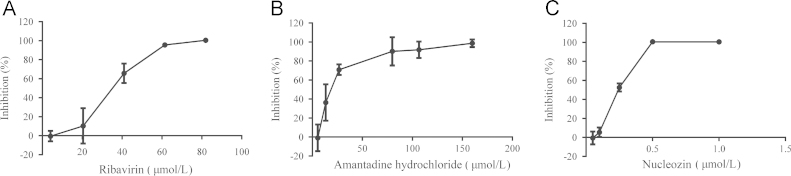
Dose–response relationships of three anti-influenza inhibitors. (A) Ribavirin; (B) amantadine hydrochloride; (C) nucleozin. Tested compounds were dissolved in DMSO at various concentrations. Data from the assay were analyzed and calculated by GraphPad Prism software. Three independent experiments were done, and representative data are shown as average±standard deviation (n=3).