
Figure 1. Principal component analysis (PCA).
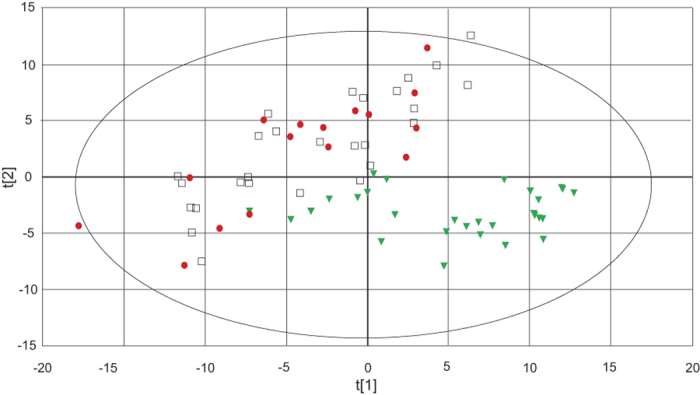
Score plot of component 1 (t[1]) and component 2 (2[t]). CWP patients ( ), NP (
 ) and CON (
 ). The score plot shows the internal correlation structure in the metabolite data. Three significant cross-validated principal components were used (R2X = 0.398; Q2 = 0.288). The ellipse shows 95% confidence interval using Hotelling T2 statistics.