
Figure 2. OPLS-DA score plot for the overview model including three groups.
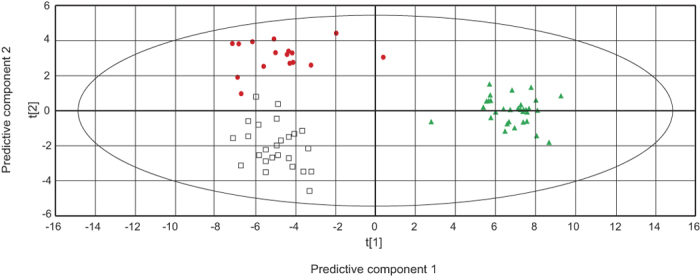
The model consists of two predictive component (p1,p2) shown in the figure and three orthogonal components (not shown). t[1] = scores for predictive component 1, t [2] = scores for predictive component 2. The model explains 41.9% of the variation in x-space and 51.1% of the variation in y-space. Explained variation of each components: R2Xp1 = 0.145; R2Xp2 = 0.02; R2Xo = 0.274. Goodness of prediction Q2cum = 0.461. CWP ( ), NP (
 ) and CON (
 ). The ellipse shows the 95% confidence interval using Hotelling T2 statistics.