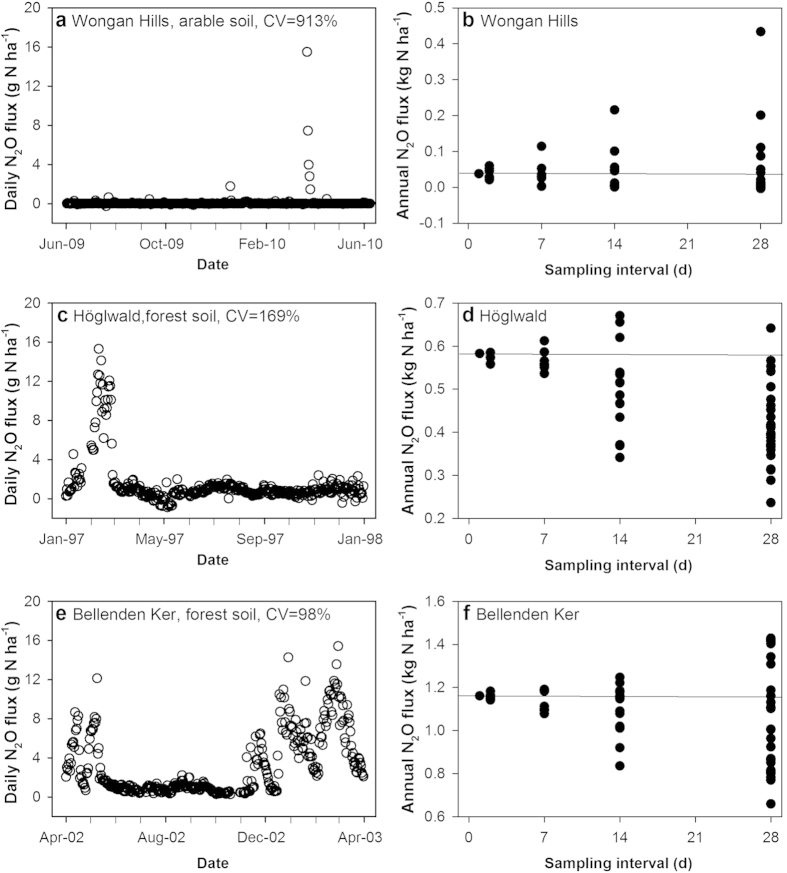
Figure 1. Daily N2O fluxes and the influence of sampling frequency on annual N2O fluxes.
The daily N2O flux (a,c,e) for the three data sets shown have varying coefficients of variation (CV), which influences the effect of sampling frequency on annual N2O fluxes (b,d,f). See Table 4 for description of sampling intervals.

