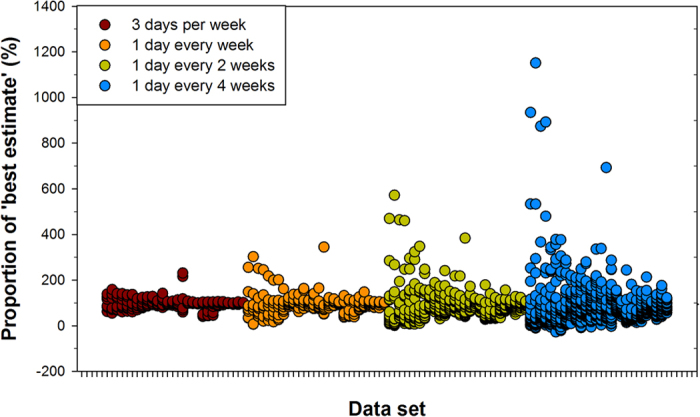
Figure 2. The proportion (%) of the ‘best estimate’ annual N2O flux estimated by each sampling frequency.

For each dataset (28), the average annual flux estimate (calculated from replicate chambers) for each sampling frequency (and each permutation, Table 4) was compared to the ‘best estimate’ flux calculated from the average daily fluxes (expressed as a %). The ‘best estimate’ was calculated using all daily fluxes. For each sampling frequency, the datasets are presented in the same order (from left to right in the above Figure) as that listed in Supplementary Table 1. Specific values for each dataset are listed in Supplementary Table 1.
