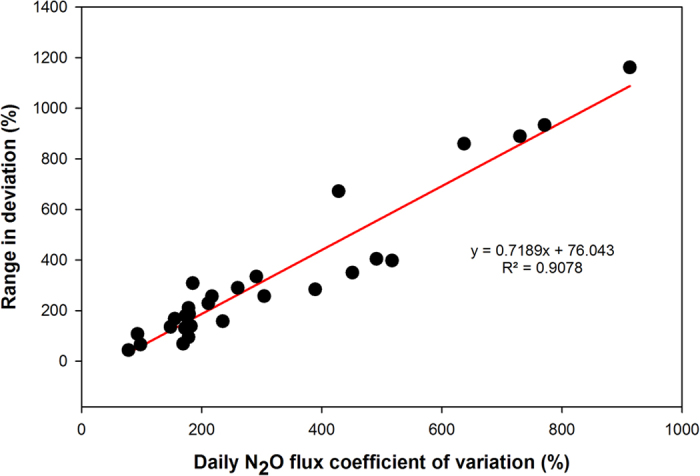
Figure 3. Relationship between the coefficient of variation of the daily N2O flux and the deviation (range) from the ‘best estimate’ annual N2O flux.

For each dataset (28; represented as single point in the above Figure), the range in deviation was determined after comparing the annual N2O fluxes calculated from a sample interval of 4-weekly (every 28 days) with the ‘best estimate’ for each permutation (Table 4). The ‘best estimate’ was calculated using all daily fluxes. Specific values for each dataset are listed in Supplementary Table 1.
