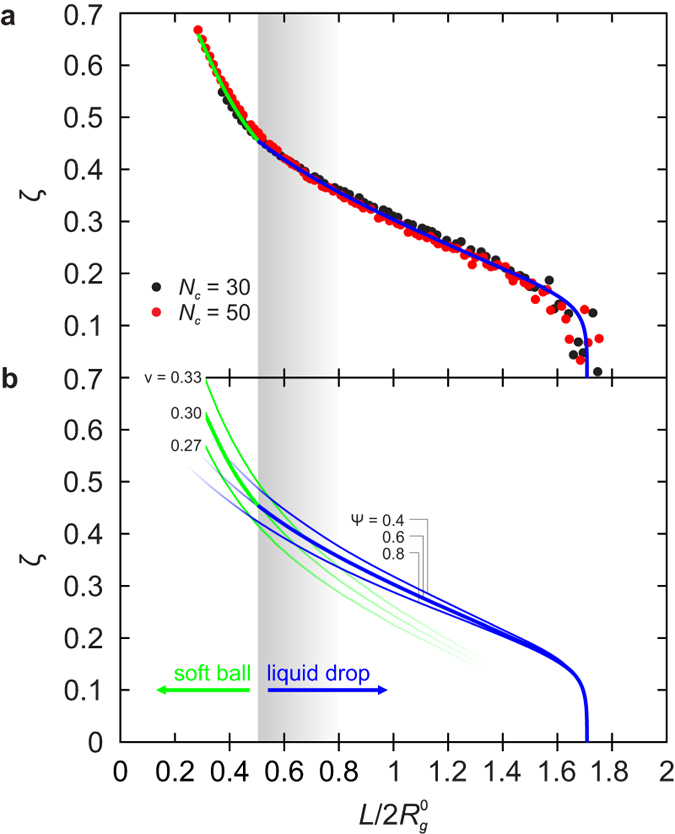
Figure 2. Liquid-drop/soft-ball fit.

(a) Reduced central lateral extension of Nc = 30 and Nc = 50 f = 60 SPB (circles) and the best fit combining the  liquid-drop model at
  (blue line) with
  soft-ball model at
  (green line). (b) Liquid-drop
  for
for  and 0.8 (blue lines) and the soft-ball
  for
for  and 0.3 (green lines). The former does not reproduce the MD results at small
  0.5 even if
  departs from the best-fit value of 0.6, and the latter predicts too small a central lateral extension in the small- and the intermediate-deformation regime irrespective of the value of
  . Each set of curves is faded at reduced slit widths where the respective model does not apply. The best-fit curves from panel a are replotted with thick lines.
