
Figure 3. Shape of deformed SPB.
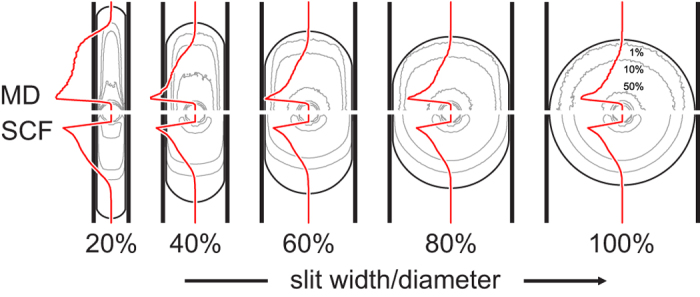
Gray lines show the monomer density isolines corresponding to 50%, 10%, and 1% of the maximal density of the thick Nc = 50, f = 60 SPB at five relative slit widths, and red curves are midplane radial profiles. Top and bottom halves shows MD and SCF results, respectively. Also plotted are the theoretical SPB contours of the combined soft-ball/liquid-drop model (solid black lines); the transition is at  .
.