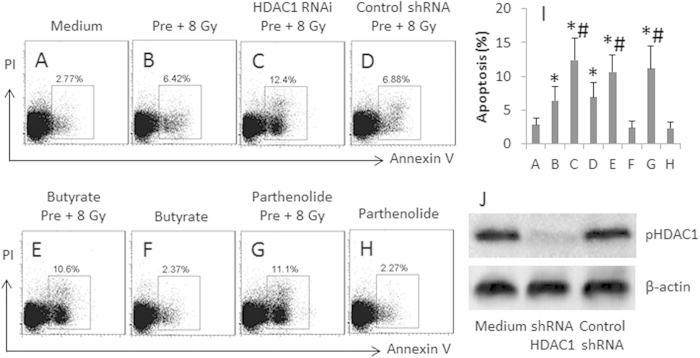
Figure 5. Inhibition of HDAC1 attenuates irradiation-induced radioprotection in U87 cells.
The treatment of U87 cells is denoted above each dot plot panel. Pre: Pre-irradiation. 8 Gy: Re-irradiation at 8 Gy. Butyrate = 5 μM. Parthenolide = 10 μM. The data are representatives of 3 independent experiments. (A-H), the gated dot plots show the frequency of apoptotic U87 cells. (I), the bars indicate the summarized data of (A-H). (J), the Western blots show the HDAC1 RNAi results. The data of bars are presented as mean ± SD. *p < 0.05, compared with group A. #p < 0.05, compared with group B. The data are representatives of 3 independent experiments.

