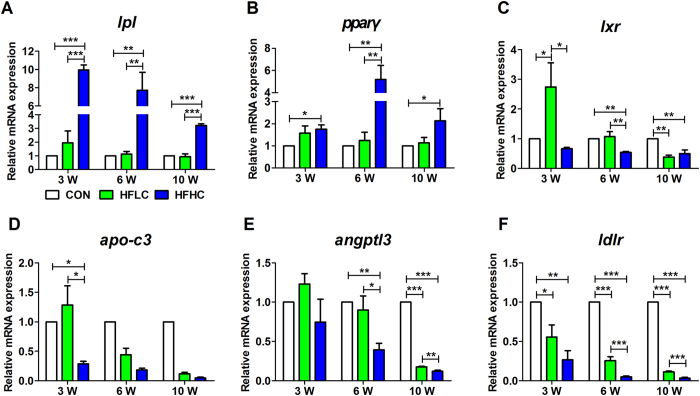
Figure 4. HFHC induced the expression of lpl and pparγ.
QPCR revealed that HFHC induced mRNA expression of lpl (A) and pparγ (B), but reversely reduced mRNA expression of lxr (C). The relative mRNA expression of apo-c3 (D), angptl3 (E), ldlr (F). Data are presented as mean ± SEM of 3–4 animals. Significant difference between two groups, *P < 0.05, **P < 0.01, ***P < 0.001.

