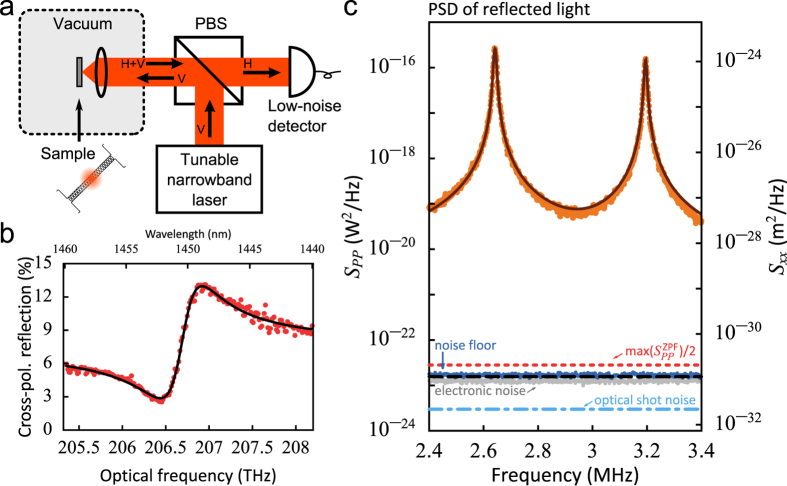
Figure 2.
(a) Schematic diagram of the free-space readout method (PBS: polarizing beamsplitter; H,V: horizontally and vertically polarized light). See Methods for details. (b) Reflection spectrum (red datapoints) and fit with a Fano lineshape (black line). (c) Power spectral density of the reflected light obtained with the laser frequency on-resonance with the cavity (orange datapoints), and a fit of the two mechanical resonances (brown line). The noise floor (blue datapoints) was obtained by reflecting the laser light from the unpatterned substrate and matching the intensity on the detector. The black dashed line is the sum of the measured electronic noise (grey datapoints) and the optical shot noise calculated from the intensity on the detector (light blue dash-dotted line). The red dotted line shows the peak value of  for the lowest-frequency resonance, which we obtained from the fit of the measured thermal spectrum via the relation
  .
.

