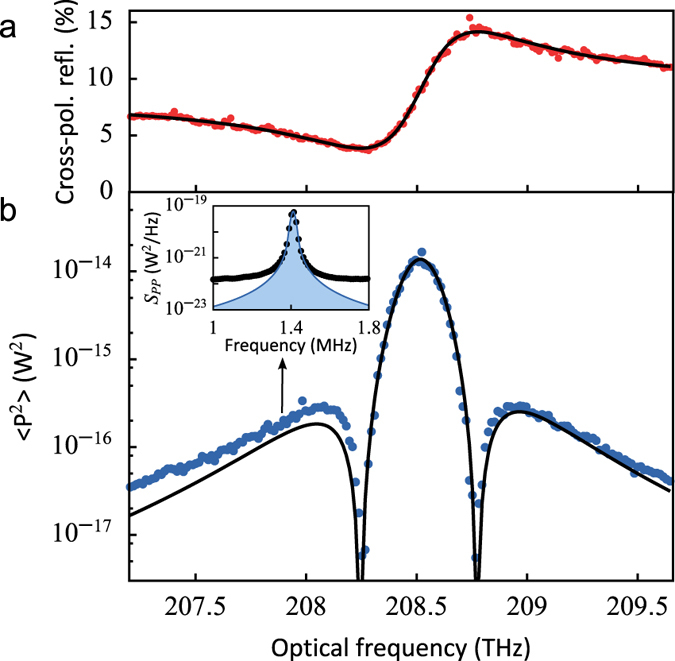
Figure 3. Sensitivity of the displacement measurement.

(a) Reflection spectrum (red datapoints) and fit with Fano lineshape (black line) for this particular nanobeam. (b) Detected optical variance in the fundamental mechanical resonance (blue datapoints) with power incident on the sample Pin = 8.5 μW. The datapoints were obtained by fitting the fundamental mechanical resonance peak in the measured modulation spectra (inset). The signal originates from thermal motion so it varies only with the sensitivity of the measurement. The black line shows our model, which uses the parameters obtained from the reflection spectrum in (a) and is fitted to the data to determine g0/2π = 11.5 MHz.
