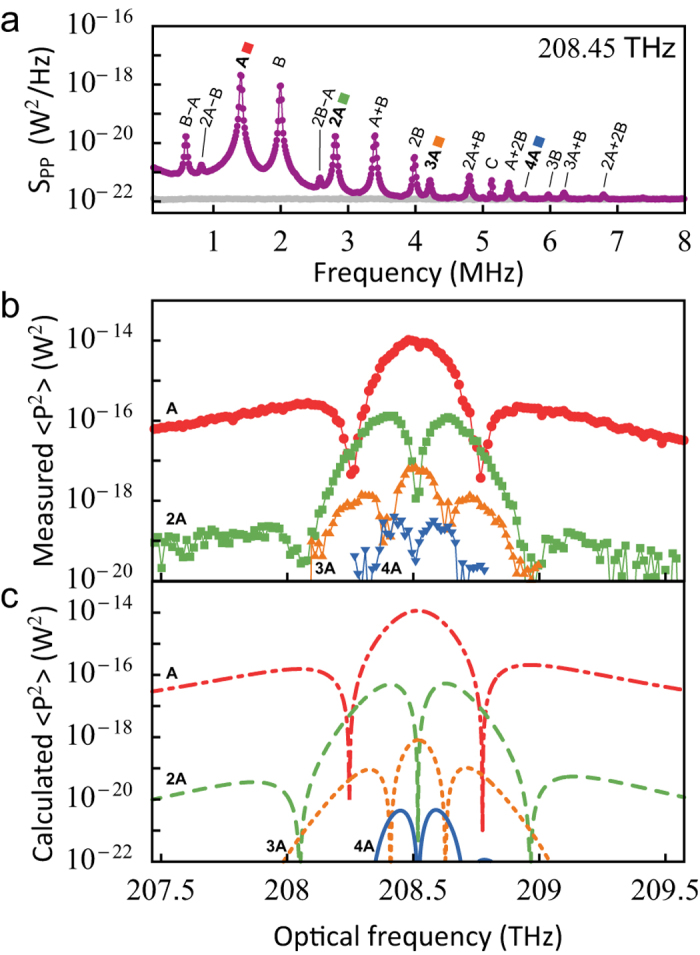
Figure 5. Nonlinear transduction.

(a) Measured mechanical spectrum of the sliced nanobeam (purple datapoints), using near-resonant light with power incident on the sample Pin = 8.5 μW. Three peaks A, B and C are mechanical resonances of the nanobeam, all other visible peaks correspond to integer multiples and combinations of frequencies A and B. The electronic noise floor is shown with grey datapoints. (b) Areas under the peaks corresponding to integer multiples of frequency A, obtained by fitting the peaks in the spectrum. (c) Calculated variance of the reflected signal, using the experimentally obtained parameters.
