
Figure 5. Relative expression analysis of (A) the abaxial-adaxial polarity genes KANADI1 (KAN1), KAN2, AUXIN RESISTANT FACTOR3 (ARF3), REVOLUTA (REV) and YABBY5 (YAB5) in Col-0, sca1-1, as2-1 and sca1-1 as2-1 plants collected 10 das, and of (B) the plastid-encoded genes rbcL, psbA, rrn16, rrn23 and atpB, in Col-0 and sca1-1 plants collected 10 das.
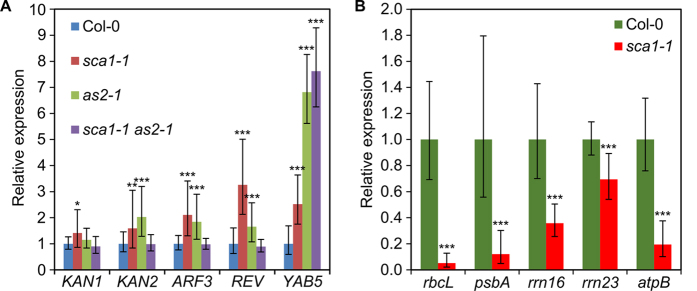
Bars indicate relative expression levels. Error bars indicate the interval delimited by 2–(ΔΔCT±SD). Asterisks indicate ΔCT values significantly different from those of Col-0 in a Mann–Whitney U-test (*p < 0.05, **p < 0.01, ***p < 0.001; n = 9).