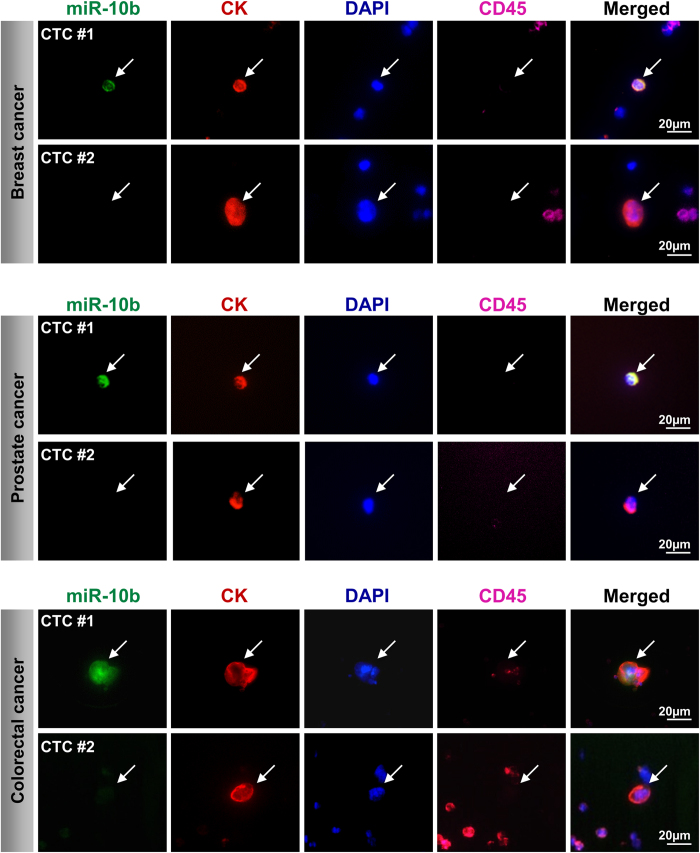
Figure 4. MiR-10b expression analysis of CTCs from metastatic cancer patients by ISH.
Shown, are miR-10b+ CK+ DAPI+ CD45− CTCs and miR-10b− CK+ DAPI+ CD45− CTCs (white arrows) captured from the blood of metastatic breast, prostate and colorectal cancer patients. Nuclei were visualized with DAPI. Resolution 40×. Scale bars, 20μM.

