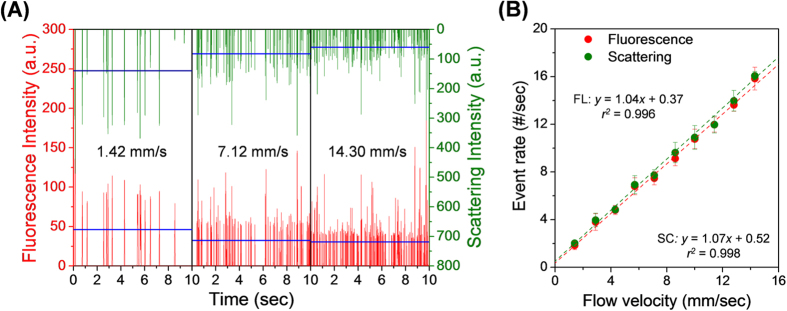
Figure 2. Fluorescence and light-scattering signals of the FLPSL particles.

(A) Fluorescence and scattering signals acquired using microfluidic flow speeds in the range 1.42–14.3 mm/s. The blue horizontal lines represent average intensities. The microfluidic flow rate of the FLPSL particle suspension in the detection zone was varied in the range 5–50 μL/h, and the sheath flow rate was varied in the range 95–950 μL/h. The ratio of core and sheath flow rates was fixed at 1/20. (B) Event rates for fluorescence and scattering signals as a function of particle flow velocity. A linear relationship is evident.
