
Figure 5. Detection and quantification of airborne microorganisms using the micro-optofluidic platform.
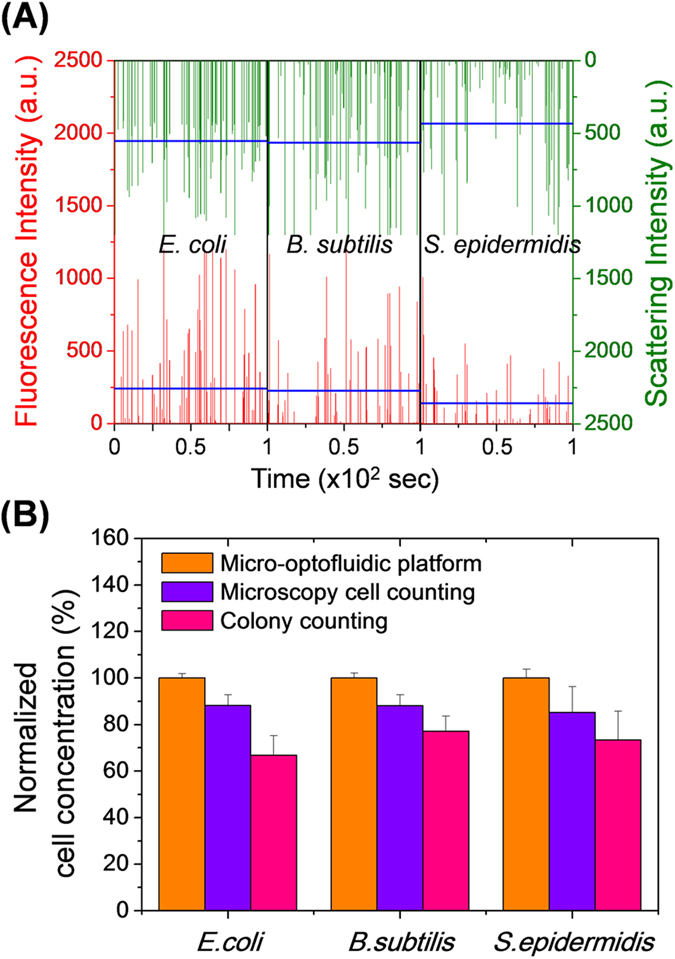
(A) Fluorescence and scattering signals acquired for E. coli, B. subtilis, and S. epidermidis. The microfluidic flow rate was 12.5 μL/h at both the sample and dye inlets, and was 237.5 μL/h for the sheath flow. The data were recorded for a total of 100 s. The blue horizontal lines indicate the mean intensities. (B) Bacterial cell concentrations measured using the micro-optofluidic platform, cell counting using fluorescence microscopy, and colony counting. The cell concentrations measured by the optofluidic platform were normalized to the fluorescence signal event rate.