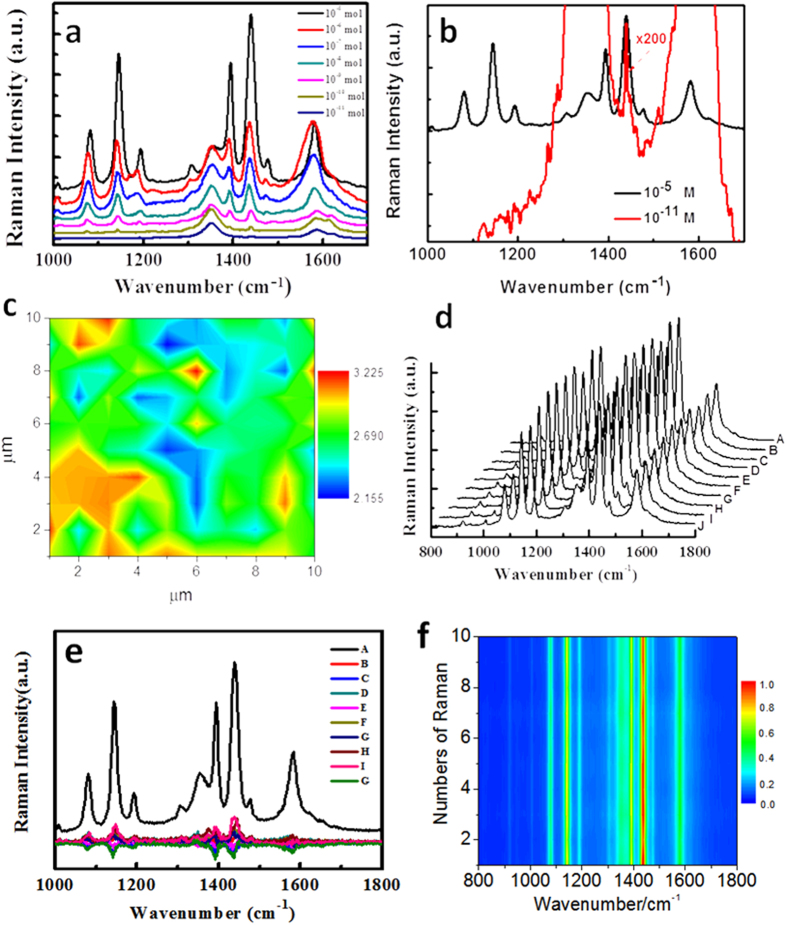
Figure 4. Molecular concentration dependent SERS of graphene enhancing plasmon-driven catalytic reaction and the uniform measurement of catalytic reaction at the laser intensity of 1 mW.
(a) Molecular concentration dependent SERS of plasmon-driven catalytic reaction, (b) SERS spectra with ×200 at the concentration of 10−11, and (c) the uniform measurement of catalytic reaction. (d) The repeatability of SERS spectra by as-measured ten SERS spectra at intervals, (e) the difference of nine other SERS spectra, compared with SERS spectrum A in (d,f ) the 2D SERS spectra of (d).

