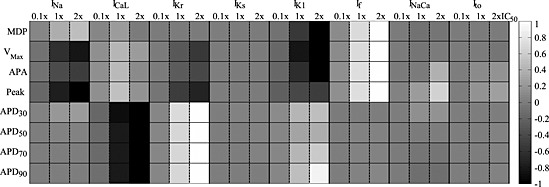
Figure 5.

Global comparison of the effect of ionic current blocks on the morphological AP biomarkers simulated by the VL hiPSC‐CM model. Stimulated APs were considered (pacing rate 60 beats min‐1). Grey levels represent the % variation of each biomarker (normalized in the interval [−1, 1], black: greatest reduction, white: greatest increment) for each block level. For IKr, biomarkers were computed 7 s after block, because for 2 × IC50 the AP was prolonged over the next stimulation pulse. APDxx, action potential duration at XX% of repolarization.
