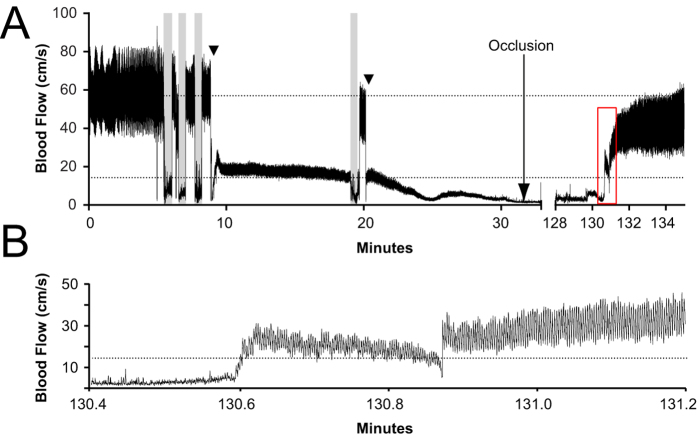
Figure 3. Doppler flow of crush and occlusion with recanalization.
Representative example of Doppler flow indicating crush injury and stenosis followed by occlusion (A). Grey shaded bars indicate 3 × 30 second crush cycles, including a recrush after 10 minutes of continuous flow. Triangles (▼) indicate tightening of silk suture to create stenosis and achieve 75% flow reductions. Dashed horizontal lines indicate baseline flow of 57 cm/s (A) and 25% baseline flow of 14.25 cm/s (A,B). Recanalization was observed at 130.6 minutes (A,B). The red box in (A) indicates the area zoomed in for (B) to show clear change from occluded “noise” to flow trace, representing recanalization. Recanalization was also confirmed by the return of audible Doppler flow correlating with flow trace.

