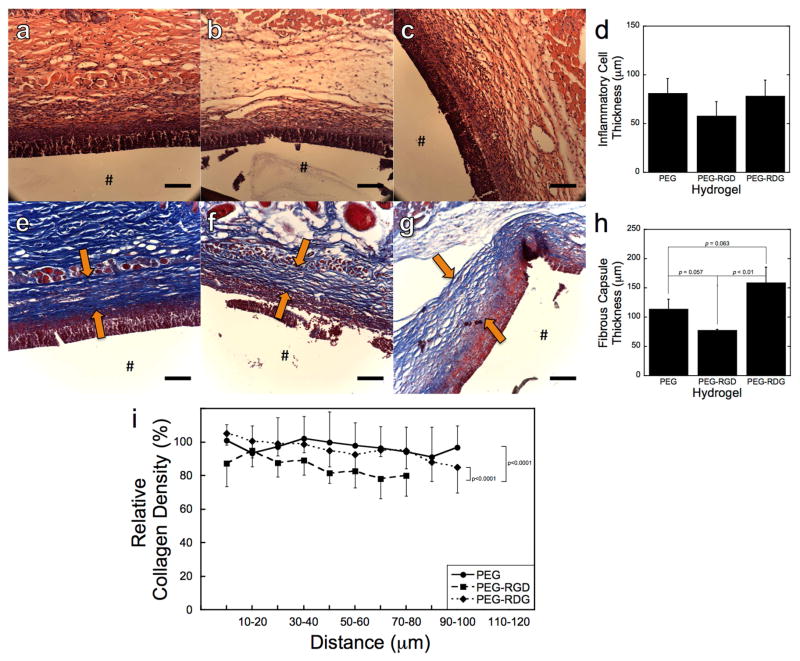
Figure 1.
Representative histological images of the in vivo response to PEG (a, e), PEG-RGD (b, f), and PEG-RDG (c, g) hydrogels 28 days post-implantation in subcutaneous pockets of C57BL/6 mice. The images show H&E (a–c), and Massons Trichrome (e–g) and stained dorsal tissue sections. The # denotes the location of the implant, which was lost during processing. Arrows mark the location of the fibrous capsule. The scale bar is 100μm. Thickness of the inflammatory cell layer (d), thickness of the fibrous capsule (h), and relative collagen density in the fibrous capsule, where intensity was normalized to the intensity of the fibrous capsule surrounding the PEG hydrogel at the location closest to the implant (i.e., 0–10 microns) (i) were measured on the dorsal side of the implanted hydrogels. Data are presented as mean with standard deviation as error bars for n=5 biological replicates per hydrogel condition.

