
Figure 5.
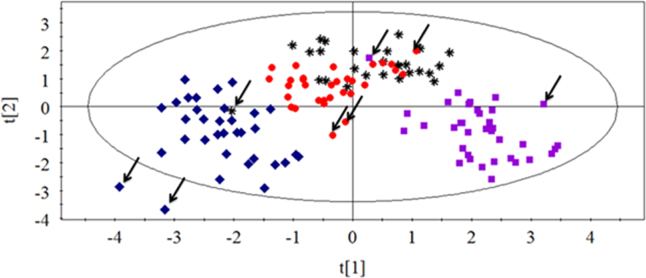
PCA score plot of cells in drug-treated groups with four classes of mechanisms of action ( Antimetabolic agents;
  agents directly acting on DNA;
  antimitotic agents;
  antibiotic agents). Points marked by arrow were outliers which had the very largest IC50 values relative to the others of their group.