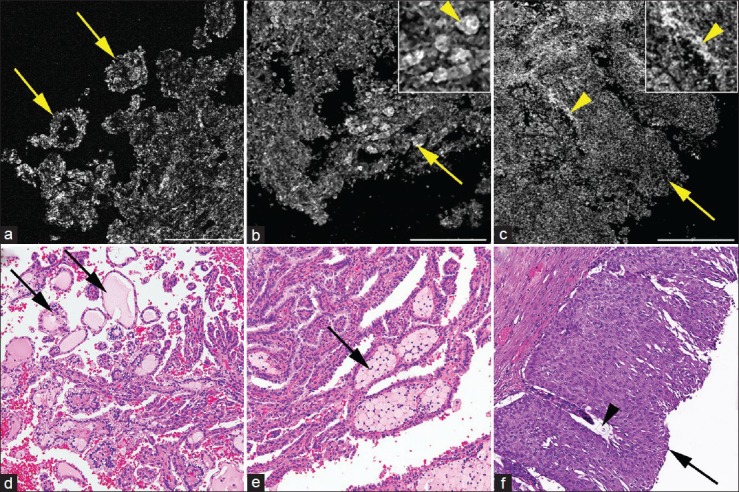
Figure 4.

Full-field optical coherence tomography (a-c) and corresponding H&E images of (d-f) of papillary kidney tumors. (a) Papillary renal cell carcinoma showing papillae (arrows). (b) Papillary renal cell carcinoma showing papillae (arrow) filled with large bright cells (arrowhead; inset) confirmed as histiocytes (arrow) on corresponding H&E (e). (c) Papillary urothelial carcinoma showing thick papillae with fibrovascular core; collagen bright signal adjacent to signal void oval blood vessel (arrow; inset with arrowhead). Full-field optical coherence tomography (a-c); scale bars = 0.25 mm. Insets = 2× zoom of images b and c, respectively, H&E (d-f); total magnifications = ×200
