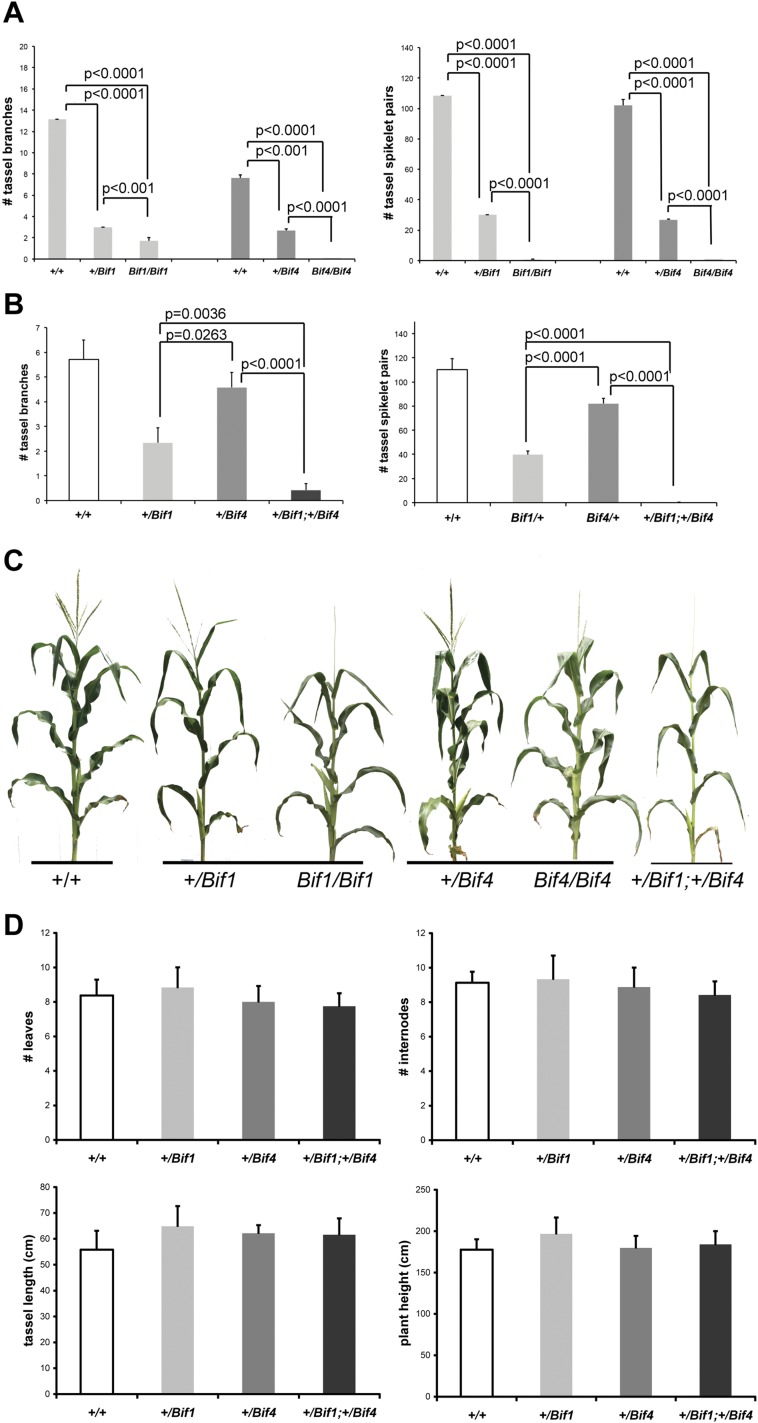
Fig. S1.
Quantification of the phenotypic defects of Bif1 and Bif4 mutants. (A) Reproductive defects in tassels of single mutants in B73 background (n ≥ 7). (B) Analysis of double mutants in A619 background (n ≥ 7). (C) Whole-plant images. (D) Analysis of vegetative and reproductive phenotypes with no detectable difference (n ≥ 6). Error bars show SD.

