Fig. S7.
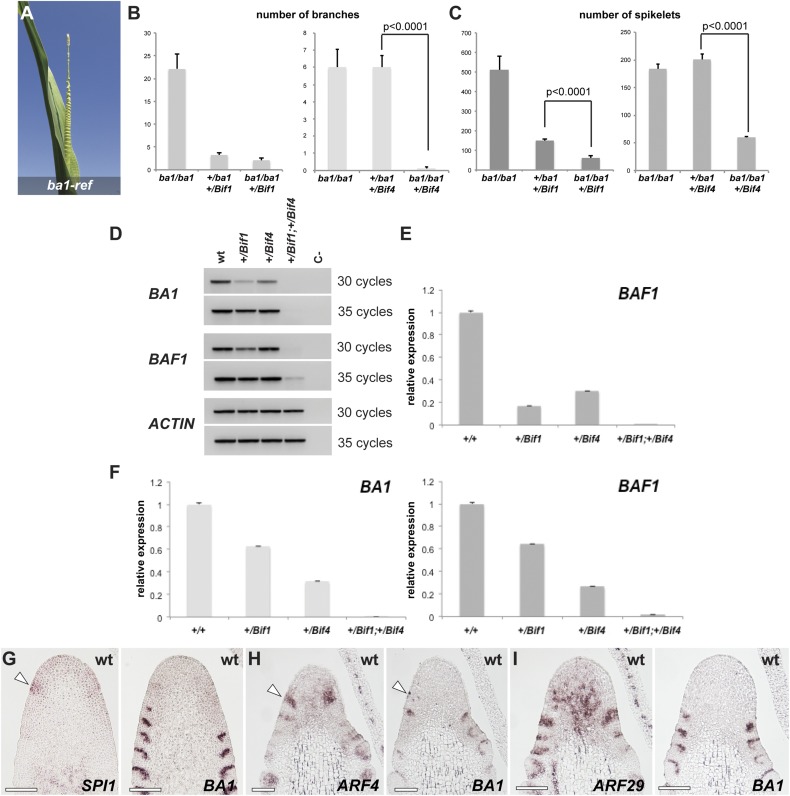
Genetic and expression analysis. (A) ba1-ref tassel. Note the enlarged suppressed bracts. (B and C) Quantification of tassel phenotypes (branch and spikelet-pair number) in Bif1;ba1-mum1 and Bif4;ba1-mum1 double mutants (n ≥ 6). Error bars, SEM. (D) Semiquantitative RT-PCRs of BA1, and BAF1 and ACTIN controls in single- and double-mutant tassels. BAF1 is a boundary-expressed gene that functions upstream of BA1 (50). (E) Quantitative RT-PCR of BAF1 (same samples as in Fig. 4; background A619). (F) Quantitative RT-PCR of BA1 and BAF1 in a B73 background. (G–I) Consecutive sections of young IMs hybridized with different in situ probes. (G) Note that SPI1 expression (arrowhead) appears before BA1. (H and I) ARF expression precedes BA1 expression (arrowheads), but later overlaps with it in slightly broader domains.

