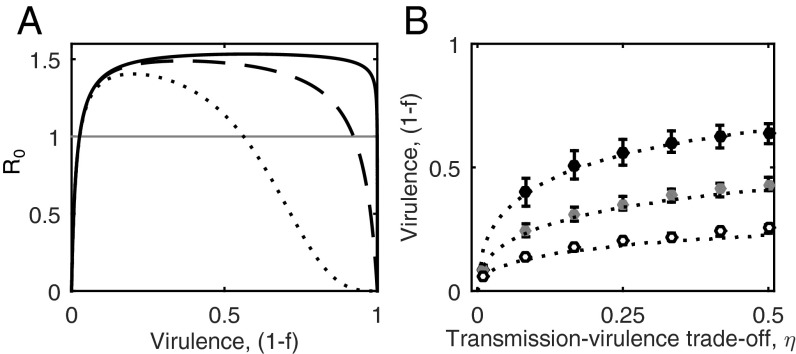
Fig. 2.
Evolution of virulence when hosts are choosy. (A) Mate choice constrains R0, such that both high and low levels of virulence lead to parasite extinction (R0 < 1; horizontal gray line). Curves show R0 for different values of the mate choice parameter, g: g = 1/3 (solid); g = 1 (dashed); and g = 3 (dotted). (B) Optimal level of virulence (1 − f) from the adaptive dynamics approach (dotted curves) compared with simulation data from the individual-based model [mean ±1 SD; g = 1/3 (black), g = 1 (gray), and g = 3 (white)]. The evolved level of virulence increases at a decelerating rate as the trade-off with transmission increases (greater η), but stricter mate choice (greater g) reduces optimal virulence. Fixed parameters as in Fig. 1, with εP = 0.1 and c = 0.

