Fig. 3.
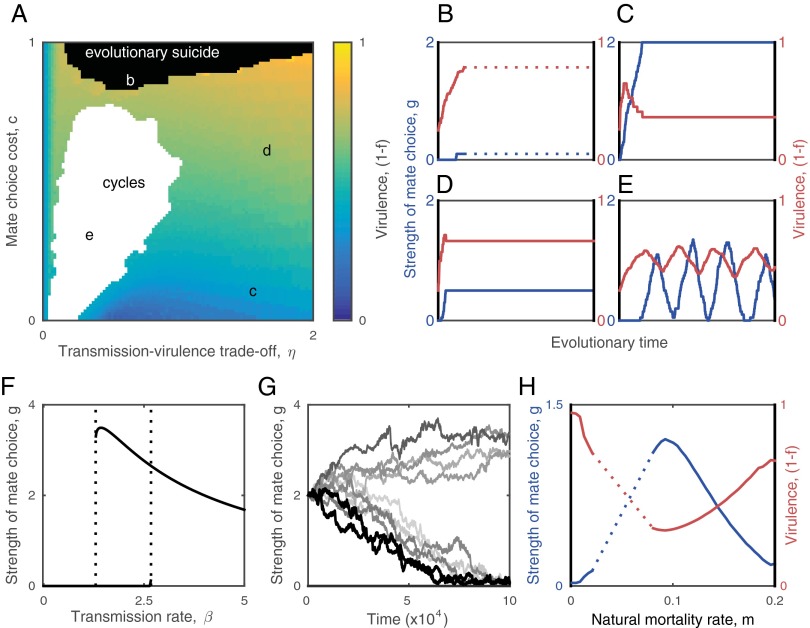
Coevolutionary dynamics of host mate choosiness and parasite virulence. (A) The evolved level of virulence increases as mate choice becomes more costly (as c increases), but it may cycle with host mate choosiness (white region). Coevolutionary trajectories for the strength of mate choice (g; blue) and virulence (1 − f; red) at points b–e are shown in the corresponding subplots. (B) Runaway selection for virulence leading to evolutionary suicide (as indicated by the dotted line). (C and D) Mate choice evolves to restrict virulence. (E) Coevolutionary cycling. (F) Bifurcation diagram showing the optimal strength of mate choice for fixed values of the transmission rate, β. Intermediate transmission rates can lead to bistablility. (G) Different coevolutionary outcomes arising from the bistability shown in F. Each trajectory corresponds to a single simulation of the IBM, seeded with the same initial conditions. The effects of the bistability are clearest when the transmission rate is allowed to coevolve with mate choice, but is constrained to a finite range (here: 1.5 ≤ β ≤ 2.5). Such constraints are likely to exist in real populations due to restrictions in both hosts (e.g., limits on sexual contact rates) and parasites (e.g., infectious dose). (H) Mate choice is maximized (and virulence minimized) for intermediate natural mortality rates, m. The dotted region indicates cycling and solid lines correspond to coevolutionarily stable strategies. All panels except G were generated by adaptive dynamics. Fixed parameters as in Fig. 1, with c = 0.1 and εH = εP = 0.01.

