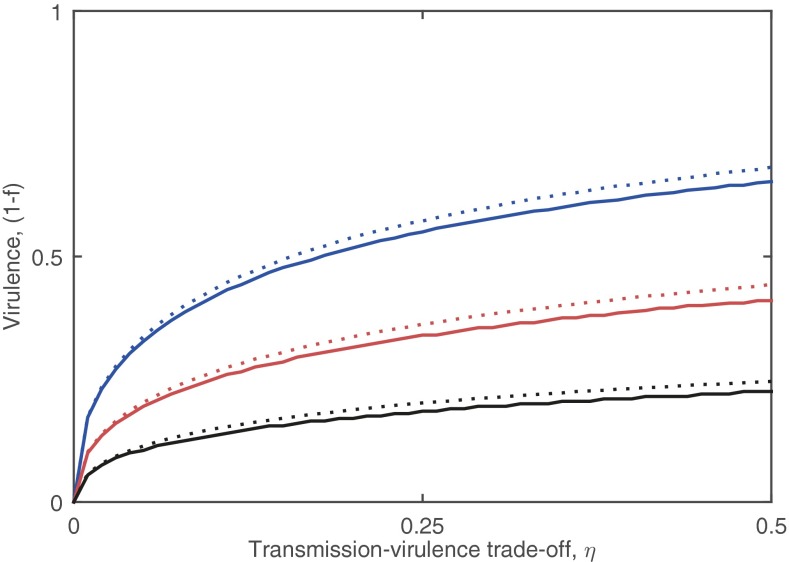
Fig. S2.
The evolutionary stable level of virulence obtained using adaptive dynamics (solid curves) and R0 maximization (dotted). R0 slightly overestimates the evolutionarily stable level of virulence (as it lacks population structuring), but provides a good approximation for the adaptive dynamics result. Colors correspond to different values of the mate choice parameter, g: g = 1/3 (blue); g = 1 (red); and g = 3 (black). Fixed parameters as in Fig. 2.

