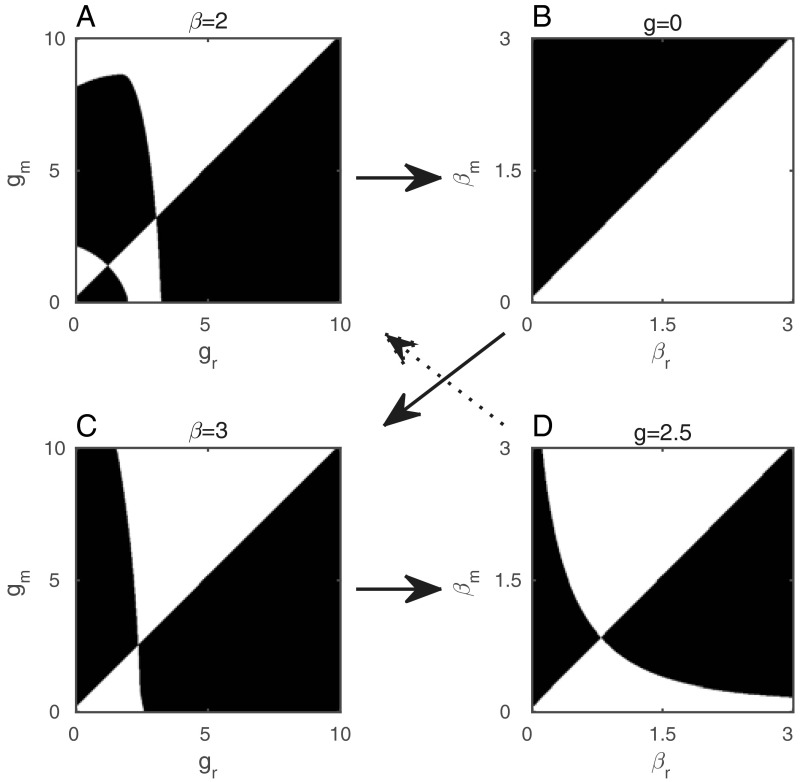
Fig. S3.
Pairwise invasion plots (PIPs) for (A and C) hosts and (B and D) parasites, showing how the coevolutionary dynamics in Fig. 3 B–E arise. Shaded regions indicate where mutants can invade. Arrows show how coevolutionary dynamics can unfold. For example, an initial lack of mate choice (A) selects for a higher transmission rate (and hence virulence) in the parasite (B). Eventually this may cross a threshold so that choosy behavior becomes optimal (C) (if not, then virulence continues to increase, potentially leading to evolutionary suicide, as in Fig. 3B). The subsequent increase in choosy behavior selects against virulence, lowering the transmission rate (D). The system may then tend toward a stable pair of strategies in each population (similar to C and D here, corresponding to the dynamics in Fig. 3 C and D), or the reduction in virulence can select against choosiness (A), leading to coevolutionary cycling (dotted arrow, as in Fig. 3E). Fixed parameters as in Fig. 1, with c = 0.1.

