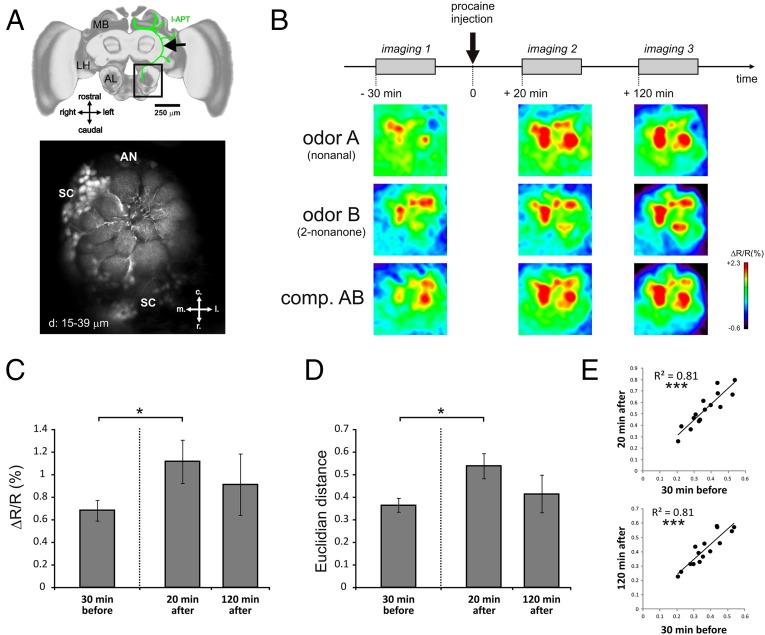
Fig. 4.
Mushroom body blockade does not impair olfactory coding in the antennal lobe. (A) Selective staining of projection neurons for calcium imaging. (Upper) Honey bee brain showing (in green) the innervation of projection neurons of the lateral tract (l-ALT) from the antennal lobe (AL) to the lateral horn (LH) and the mushroom body (MB) calyces. The location of the calcium-dye (Fura-2 dextran) injection is shown by a black arrow. (Scale bar: 250 μm.) (Lower) Typical retrograde staining of l-ALT projection neurons showing their dendrites in AL glomeruli. AN, antennal nerve location; c, caudal; l, lateral; m, medial; r, rostral; SC, PN somata cluster. d, 15–39 µm = Z-projections of optical slices at 15–39 µm depth. (B) Time course of imaging experiment: Bees were subjected to an imaging session 30 min before, 20 min after, and 120 min after procaine injection in the vertical lobes. Below the time course, typical activity maps are shown for the odorants A (nonanal), B (2-nonanone), and their binary mixture (AB) at the different time points of the experiment. Maps are displayed according to a false color code, from dark blue (no activity) to red (maximum activity)(see lateral bar % ΔR/R). (C) Average intensity (ΔR/R in %) of glomerular calcium responses to the odor panel in the three imaging sessions. A significant increase in response intensity was observed 20 min after injection of procaine (Wilcoxon matched-pairs test, P = 0.038, n = 9), which then returned to baseline 120 min after injection (P = 0.91, n = 6). (D) Average Euclidian distance (dissimilarity measure) between odor-response maps for all odor pairs of our panel. An increase in Euclidian distance (i.e., an increase in dissimilarity) was observed 20 min after injection of procaine (P = 0.011, n = 9), which then returned to baseline 120 min after injection (P = 0.46, n = 6). (E) Similarity relationships between odor response patterns are conserved before and after procaine injection. (Upper) Euclidian distances for all odor pairs are highly correlated 30 min before and 20 min after procaine injection (Pearson correlation, P < 0.001). (Lower) Euclidian distances are likewise highly correlated 30 min before and 120 min after procaine injection (P < 0.001). Error bars correspond to SEM.

