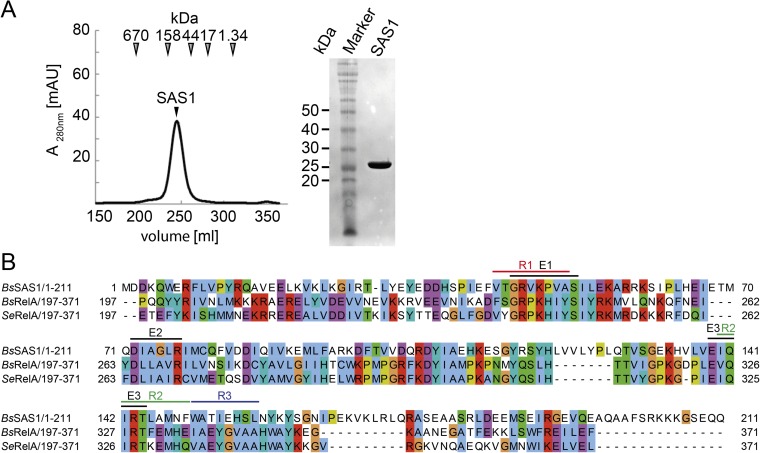
Fig. S1.
(A) SAS1 forms a homotetramer. (Left) SEC profile of SAS1. Arrowheads indicate the mass of the size standard. (Right) Coomassie-stained SDS/PAGE of the peak fraction containing SAS1. (B) Amino acid sequence alignment of SAS1 and RelA. Colored lines indicate E1–E3 and R1–R3. Bs, B. subtilis; Se, Streptococcus equisimilis.

