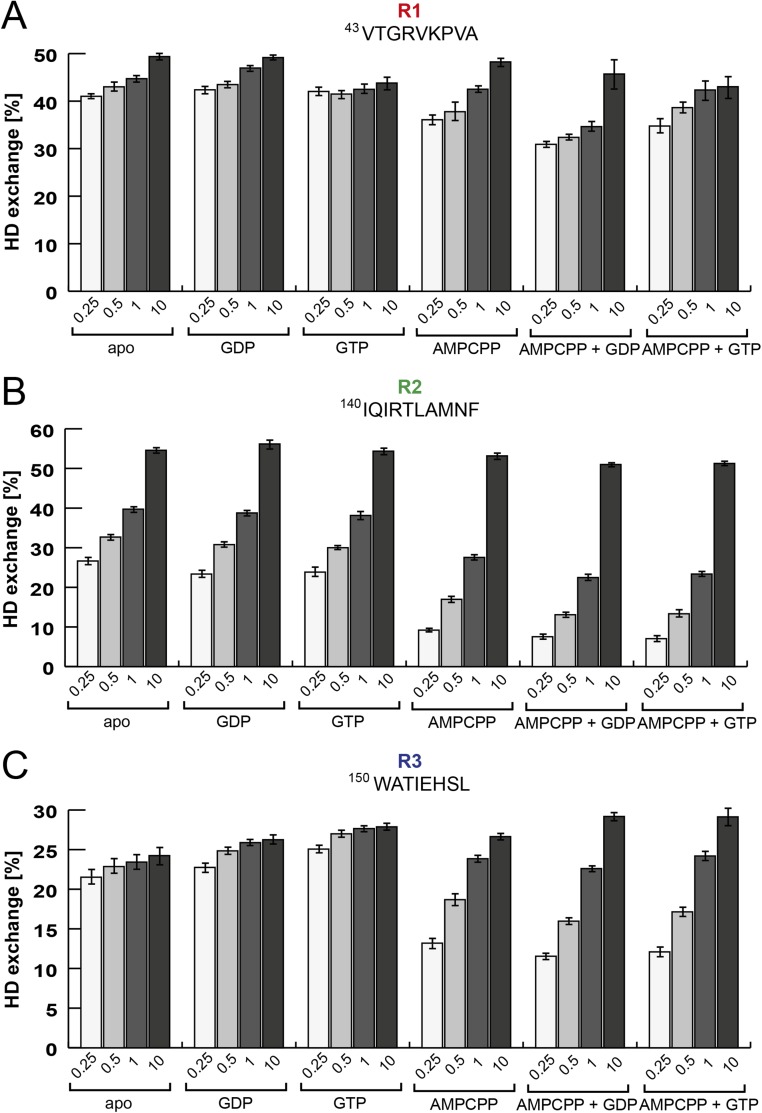
Fig. S2.
HDX of three regions located within the active site of SAS1. The graphs show the percentage of deuterium uptake of three individual peptides (amino acid sequences are listed above the plots) representing three regions within the active site of SAS1 in different nucleotide-bound states. Deuteration times in minutes are indicated below the bars. Error bars represent the SD of three independent measurements. (A) Peptide R1 (VTGRVKPVA). (B) Peptide R2 (IQIRTLAMNF). (C) Peptide R3 (WATIEHSL).

