Fig. S3.
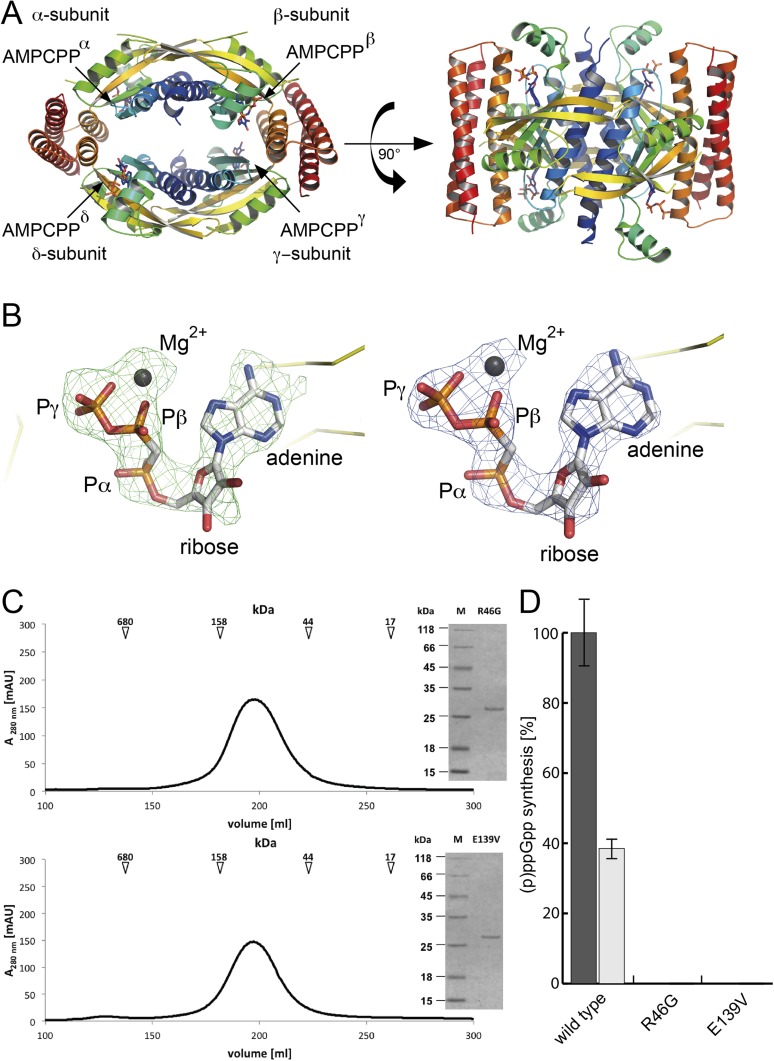
(A) The crystal structure of tetrameric SAS1 bound to AMPCPP is shown in cartoon representation. Each monomer appears in rainbow colors from the N terminus to the C terminus. The AMPCPP molecules are shown as sticks and are indicated by arrows. (B) AMPCPP could be assigned unambiguously within the active site of SAS1. (Left) The unbiased Fobs–Fcalc difference electron density of AMPCPP contoured at 2.5 σ is shown as green mesh. Note: The AMPCPP molecule (sticks) and magnesium (gray sphere) were not present during refinement and are placed only for reasons of illustration. (Right) The 2Fobs–Fcalc electron density of AMPCPP/magnesium (sticks and gray sphere, respectively) after final refinement is contoured at 2.5 σ and shown as blue mesh. Yellow ribbons indicate the backbone of SAS1. Figures were generated with PyMOL. (C) SEC profile and Coomassie-stained SDS/PAGE (Inset) of the SAS1 variants R46G (Upper) and E139V (Lower). The arrows indicate the mass of the SEC size standard. (D) Synthesis of ppGpp (black bar) and pppGpp (gray bar) by wild-type SAS1 and the variants R46G and E139V. Two micromoles of SAS1 were incubated in the presence of 5 mM ATP and 5 mM GDP or GTP for 10 min at 37 °C and were subjected to HPLC measurement. Synthesis of ppGpp by wild-type SAS1 is set at 100%. Error bars represent the SD of three independent measurements.

