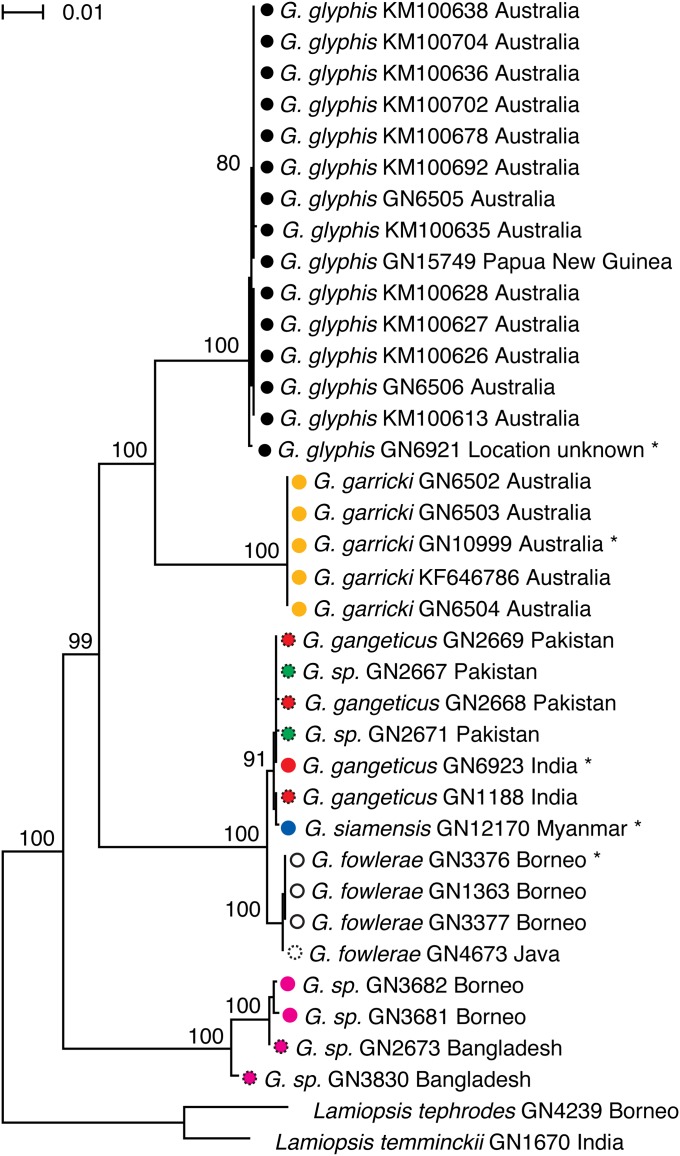
Fig. 2.
Maximum-likelihood tree based on a partitioned analysis of the protein-coding portion of the mitochondrial genome using a GTR + Γ (39) model for each codon partition. Type specimens are indicated by an asterisk. Colors are as in Fig. 1. Locality information is available in SI Appendix, Table S1. Bootstrap support values are indicated on the branches.

