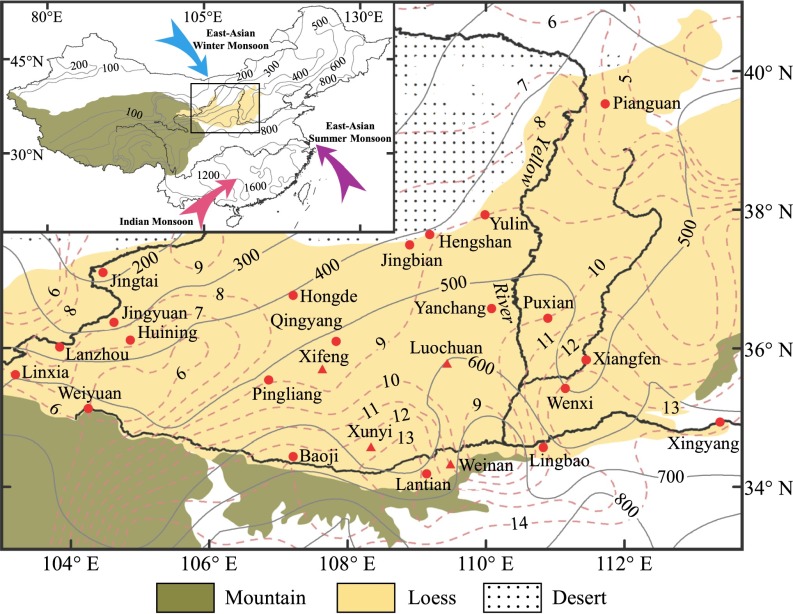
Fig. 1.
Chinese Loess Plateau, prevailing monsoon circulation, and modern climatic gradients. Solid circles show locations of 21 sites investigated in this study, and solid triangles denote locations of 4 additional sites previously studied by Liu et al. (14). Arrows in Inset map indicate the direction of the winter and summer monsoonal winds. The isohyets (in millimeters; gray lines) and isotherms (in degrees Celsius; dashed lines) are values averaged over 51 y (1951–2001).

