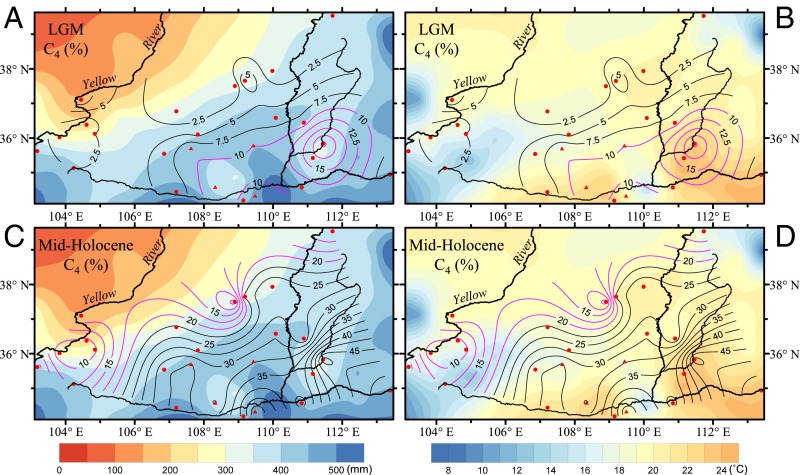
Fig. 5.
Contour maps of estimated C4 biomass (%) for the Last Glacial Maximum (LGM) (A and B) and the mid-Holocene (C and D), together with modern mean warm-season precipitation (A and C) and temperature (B and D) (May to September) over 51 y (1951–2001). The C4 biomass was calculated using δ13C data from the 21 sites in this study (solid circles; Figs. 1 and 2) and four additional sites in Liu et al. (14) (solid triangles; Fig. 1). Note the migration of the 10–20% isolines for C4 biomass (pink lines) between the LGM and the mid-Holocene.

