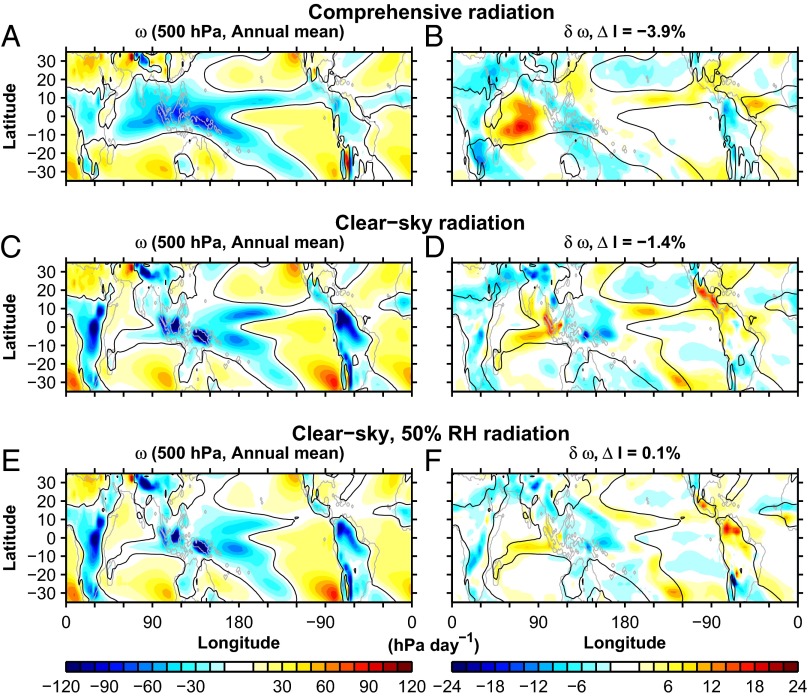
Fig. S2.
AM2.1 GCM simulations using the climatological SST over the period 1981–2005 from the Hadley Centre HadISST dataset (32), rather than from the coupled GCM (ESM2M) as shown in Fig. 1 and Fig. S1. (A, C, and E) Annual-mean pressure velocity ω at 500 hPa for 1 × CO2, climatological SST, and sea ice simulations, and (B, D, and F) the change in pressure velocity δω at 500 hPa between 4 × CO2 and 1 × CO2 simulations (unchanged SST and sea ice) for the (A and B) standard radiative transfer, (C and D) the clear-sky radiative transfer calculation, and (E and F) the clear-sky, 50% relative humidity (RH) radiative transfer calculation. This additional simulation type uses radiative transfer calculations that assume clear-sky conditions and 50% RH at all atmospheric levels. The time-dependent, GCM-simulated temperature and pressure fields are used to determine the water vapor distribution. Thus, radiative transfer calculation uses 50% RH in both the ascending and subsiding branches of the tropical circulation. Specifying constant RH for radiative transfer rather than specific humidity has the virtue that the humidity stratification arising from the climatological temperature stratification preserved and regions of unphysical subsaturation or supersaturation are avoided. The percent change in the tropical circulation strength index (ΔI) between 4 × CO2 and 1 × CO2 simulations is shown in the title (B, D, and F).

