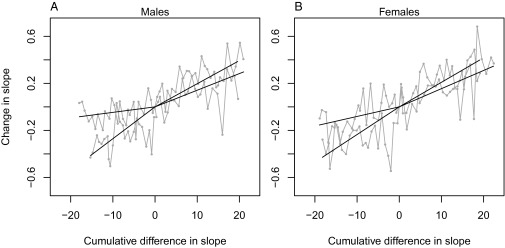
Fig. 4.

The selection response of the allometric slope as a function of a measure of cumulative selection strength in males (A) and females (B). The cumulative selection strength is measured as the cumulative difference between the allometric slope of all individuals under selection and the allometric slope of the selected individuals (i.e., the difference between the thick and the thin regression line in Fig. 3). Note that this is not a proper measure of the selection differential because it does not reflect the difference in the underlying slope of each individual. Therefore, the regression lines in the figure do not represent true realized heritabilities, but still give some information about the response to selection. The regression lines, slope ± SE, are 0.0196 ± 0.0022 and 0.0142 ± 0.0022 for up-selected males, 0.0047 ± 0.0025 and 0.0271 ± 0.0029 for down-selected males, 0.0209 ± 0.0024 and 0.0155 ± 0.0022 for up-selected females, and 0.0081 ± 0.0025 and 0.0235 ± 0.0026 for down-selected females.
