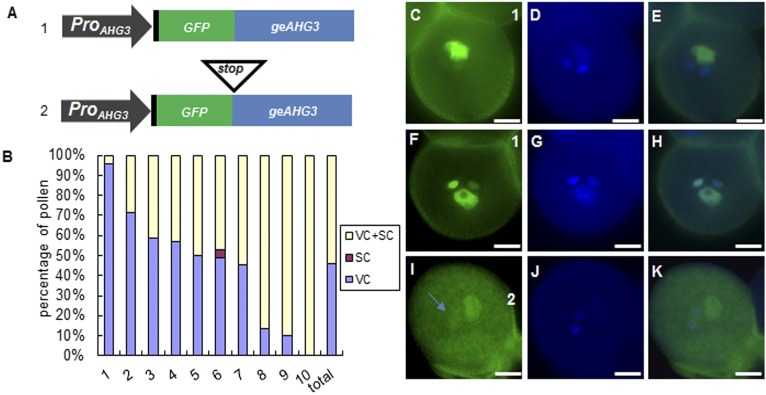
Fig. 4.
Localization patterns of GFP-AHG3 and GFP-Stop-AHG3. (A) Diagrams of constructs. The 5′ UTR is shown in black, GFP is shown in green, and AHG3 is shown in blue. (B) Percentage of localization patterns in pollen expressing ProAHG3:GFP-geAHG3. The data represent pollen from 10 independent T1 lines, and the total bar shows the average from 10 T1 plants. SC, sperm cells; VC, vegetative cells. (C–K) Representative images of pollen expressing ProAHG3:GFP-geAHG3 (C–H) or ProAHG3:GFP-Stop-geAHG3 (I–K). C, F, and I are GFP images. D, G, and J are DAPI images. E, H, and K are merged GFP/DAPI images. The arrow in I marks GFP in sperm cell nuclei. (Scale bars, 5 μm.)

