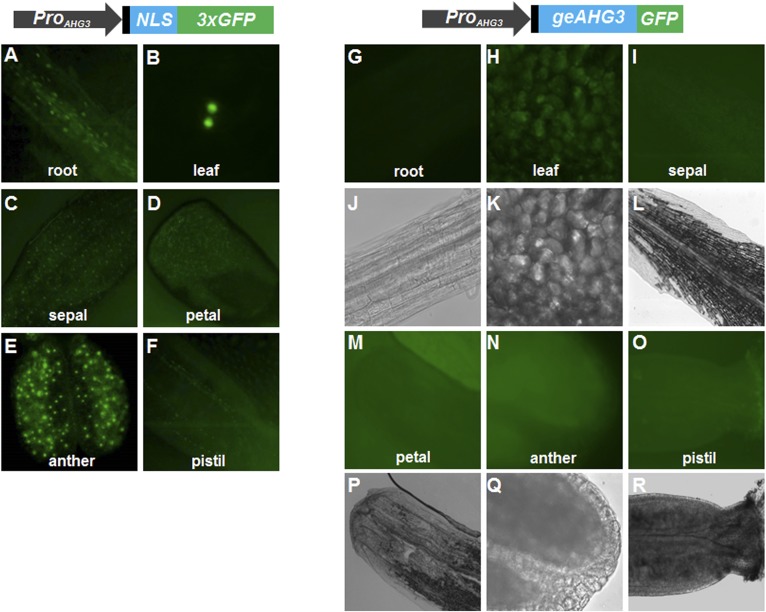
Fig. S1.
Expression pattern of ProAHG3:NLS-3xGFP and ProAHG3:geAHG3-GFP in different tissues. The 5′ UTR is shown in black. (A–F) Representative images of ProAHG3:NLS-3xGFP expression in root, leaf, and various flower parts. (G–R) Representative images of ProAHG3:geAHG3-GFP expression in root, leaf, and various flower parts. A–F, G–I, and M–O are GFP images. J–L and P–R are brightfield images.

